Indiana vs. Ohio State By the Numbers: Where the Hoosiers and Buckeyes Have the Edge
By Coach Griff | HoosierTailgate.com | October 14, 2026
Saturday’s Indiana–Ohio State showdown features two of the Big Ten’s most productive offenses and two of its stingiest defenses. Both teams have played six games, which makes the statistical comparison unusually clean. The official Big Ten numbers reveal different offensive identities—and several matchups that could decide the game.
Statistical source: Big Ten Conference 2026 overall football statistics, reviewed October 13, 2026. All per-game averages are through six games for each team; they are not conference-only statistics.
Two Elite Teams, Remarkably Similar Results
Before breaking down where Indiana and Ohio State differ, consider just how closely their production mirrors one another. Through six games, the Buckeyes average 42.7 points and the Hoosiers 40.2—a difference of only 2.5 points per game. Indiana allows 11.8 points per game and Ohio State 13.2, a gap of just 1.4. The Hoosiers average 7.8 yards per offensive play to Ohio State’s 7.3. Both teams have produced nearly the same number of offensive touchdowns: 30 for Indiana and 33 for Ohio State.
Perhaps the most remarkable comparison is third-down offense. Indiana is converting 45.3% of its chances; Ohio State is converting 45.2%. That’s a difference of one-tenth of one percentage point through six games. Indiana has thrown 19 touchdown passes; Ohio State has thrown 20. These are not identical teams, but they have delivered strikingly similar results in some of football’s most consequential categories.
Look beyond the averages, though, and their identities begin to separate. Indiana averages 55.6 more rushing yards per game, while Ohio State averages 96.5 more passing yards. The Hoosiers have recorded 20 sacks compared with the Buckeyes’ nine, yet Ohio State has been more effective by opponent passing-efficiency rating. Indiana has the edge in scoring and rushing defense; Ohio State allows fewer total and passing yards. Each team has strengths that directly challenge the other’s preferred style of play.
Coach Griff’s takeaway: The numbers tell us this is not simply a matchup between two highly ranked programs. It is a meeting of two teams performing at an exceptionally similar level, often by very different means. Saturday’s question is which team’s strengths translate against the best competition it has faced—and which staff can force the other to play outside its comfort zone.
Indiana vs. Ohio State: Season Statistical Comparison
| Category | Indiana | Ohio State |
|---|---|---|
| Scoring offense (PPG) | 40.2 | 42.7 |
| Scoring defense (PPG allowed) | 11.8 | 13.2 |
| Total offense (YPG) | 462.7 | 503.5 |
| Total defense (YPG allowed) | 263.3 | 246.8 |
| Rushing offense (YPG) | 221.3 | 165.7 |
| Rushing defense (YPG allowed) | 75.0 | 96.2 |
| Passing offense (YPG) | 241.3 | 337.8 |
| Passing defense (YPG allowed) | 188.3 | 150.7 |
| Offensive yards per play | 7.8 | 7.3 |
| Third-down offense | 29/64 (45.3%) | 33/73 (45.2%) |
| Third-down defense | 28/88 (31.8%) | 30/83 (36.1%) |
| Red-zone scoring | 22/24 (91.7%) | 26/30 (86.7%) |
| Red-zone touchdowns | 18/24 (75.0%) | 21/30 (70.0%) |
| Red-zone defense: TD allowed | 6/11 (54.5%) | 5/11 (45.5%) |
| Sacks recorded | 20 | 9 |
| Sacks allowed | 9 | 11 |
| Penalty yards per game | 28.8 | 52.3 |
1. Indiana’s Ground Game Meets a Strong Ohio State Defense
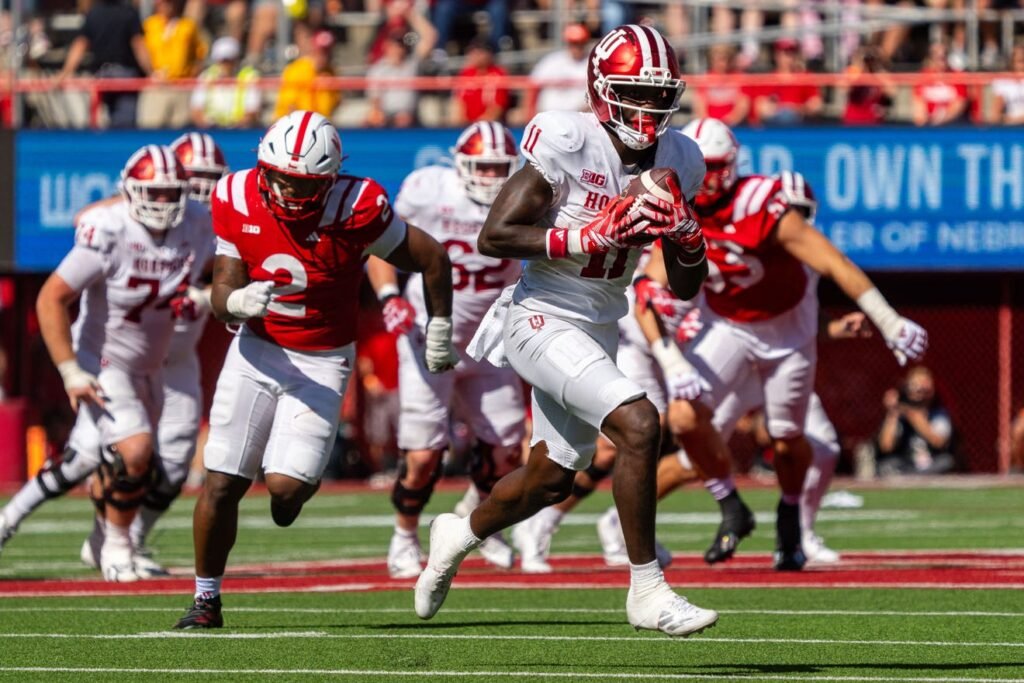
Indiana averages 221.3 rushing yards per game and 6.1 yards per carry. Ohio State is allowing 96.2 rushing yards per game and 3.2 yards per opponent carry. On the surface, Indiana has the stronger rushing résumé. But those full-season averages should not obscure what we saw at Nebraska: the Hoosiers had difficulty creating consistent movement and generating variety in the run game.
Coach Griff’s evaluation: Indiana cannot rely exclusively on inside zone and duo against this defense. Formational variation, motion and attacking the perimeter are ways to force Ohio State to defend more than the B gaps. The objective is to keep Indiana out of predictable second- and third-and-long situations.
2. Ohio State’s Passing Volume Is a Major Challenge
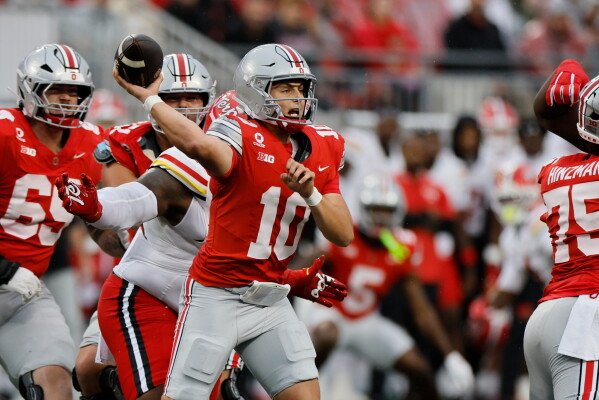
The Buckeyes average 337.8 passing yards per game compared with Indiana’s 241.3. Ohio State’s overall offense generates 503.5 yards per game; Indiana’s produces 462.7. Yet Indiana averages more yards per play, 7.8 to 7.3, demonstrating that volume and per-snap production tell different stories.
Ohio State has completed 71.8% of its passes, with 20 passing touchdowns and five interceptions. Indiana’s passing offense has completed 67.9%, with 19 touchdowns and no interceptions in the Big Ten’s team passing table. The matchup demands disciplined coverage and coordinated pressure; allowing Ohio State easy completions on early downs will make an already dangerous passing attack even harder to defend.
3. Indiana’s Pass Rush Could Change the Game
The Hoosiers lead the conference’s sacks-by table with 20 through six games. Ohio State has recorded nine. Indiana has allowed nine sacks, while the Buckeyes have allowed 11.
That creates one of the most important tactical matchups of the afternoon: Indiana’s defensive front against Ohio State’s protection. The Hoosiers need pressure without sacrificing rush-lane discipline, while the Buckeyes must avoid letting negative plays derail drives. The 20-to-9 sack comparison describes production to date; it does not guarantee the same pressure rates against Saturday’s opponent.
4. Third Downs and Red-Zone Touchdowns Will Matter
These offenses are virtually identical on third down: Indiana converts 45.3% of its opportunities and Ohio State 45.2%. The difference is on defense. Indiana has allowed opponents to convert 31.8% of third downs, compared with Ohio State’s 36.1%.
Indiana also scores on 91.7% of red-zone trips, compared with Ohio State’s 86.7%. But touchdowns, not just scores, are the sharper measure: Indiana has reached the end zone on 18 of 24 trips (75.0%), while Ohio State has 21 touchdowns in 30 trips (70.0%). These are season-long figures; finishing drives inside the five-yard line remains an area Indiana must execute consistently against elite competition.
5. Defense, Discipline and Hidden Yardage
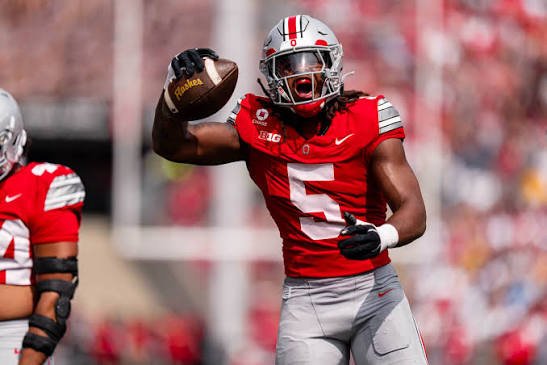
Indiana allows 11.8 points and 263.3 yards per game. Ohio State allows 13.2 points but just 246.8 yards per game. The Hoosiers have the scoring-defense advantage; the Buckeyes have the total-yardage-defense advantage. Both are outstanding.
There is also a meaningful discipline gap in the official statistics: Indiana averages just 28.8 penalty yards per game, compared with Ohio State’s 52.3. In a tight game, field position and self-inflicted mistakes can turn one possession into the difference.
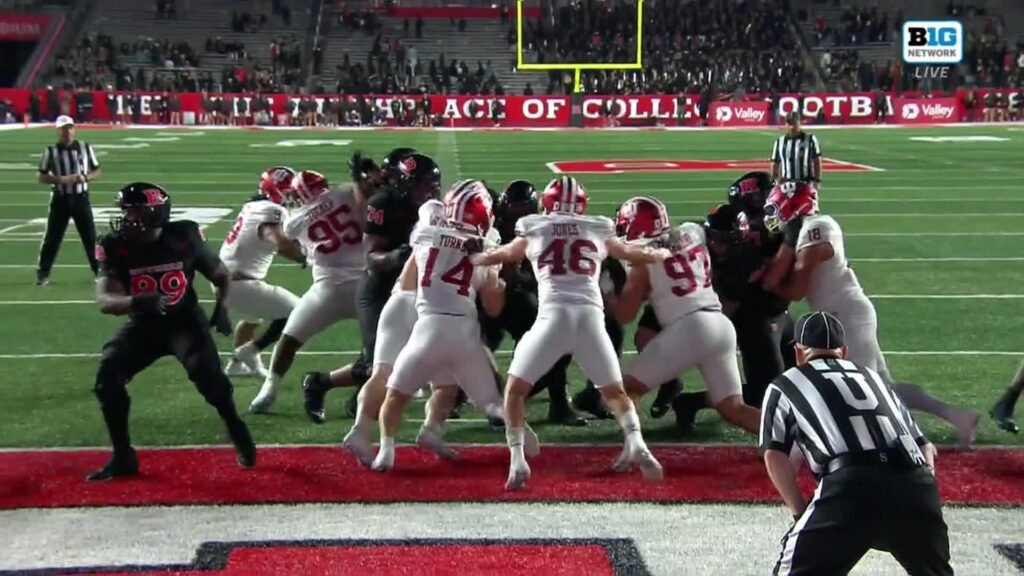
The Quarterbacks: Efficiency Versus Passing Volume
| Six-game statistics | Josh Hoover, Indiana | Julian Sayin, Ohio State |
|---|---|---|
| Completions / attempts | 88 / 129 | 116 / 163 |
| Completion percentage | 68.2% | 71.2% |
| Passing yards | 1,364 | 1,772 |
| Passing touchdowns | 17 | 17 |
| Interceptions | 0 | 2 |
| Passer efficiency rating | 200.5 | 194.4 |
Sayin has the yardage and completion-percentage advantage. Hoover has matched him in touchdown passes while avoiding an interception and posting the slightly higher passer-efficiency rating. Importantly, Ohio State’s team passing total of five interceptions includes throws by quarterbacks other than Sayin; his individual total is two. For Indiana, the question is not whether Hoover can match the Buckeyes’ passing volume. It is whether the Hoosiers can sustain their explosive efficiency against a defense allowing just 150.7 passing yards per game and a 92.4 opponent passer-efficiency rating.
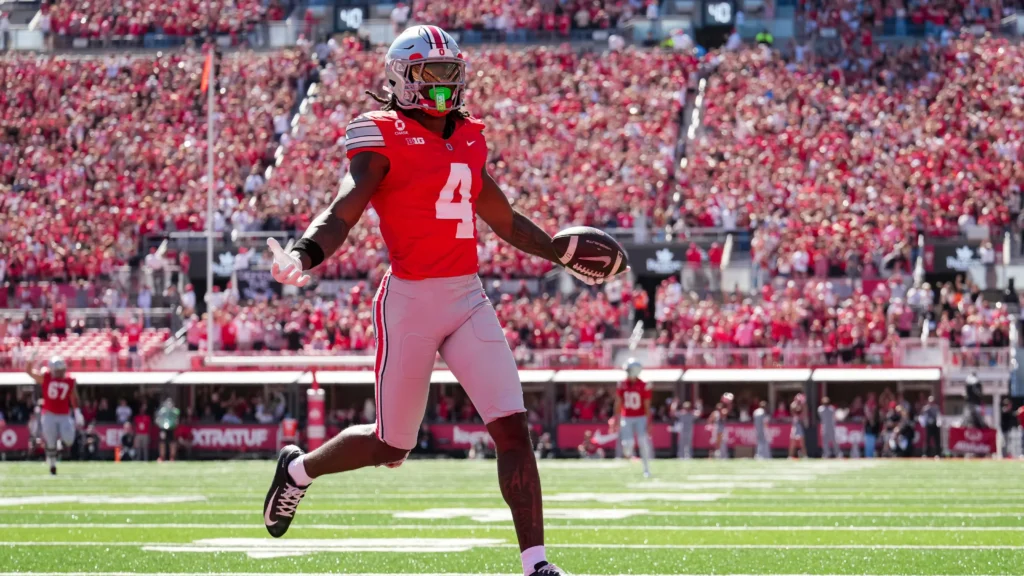
Playmakers: Different Ways to Create Explosive Offense
| Player | Production through six games |
|---|---|
| Indiana RB Turbo Richard | 71 carries, 597 yards, 8.4 per carry, 5 TD |
| Indiana RB Lee Beebe Jr. | 98 carries, 551 yards, 5.6 per carry, 4 TD |
| Ohio State RB Bo Jackson | 89 carries, 460 yards, 5.2 per carry, 4 TD |
| Ohio State RB Ja’Kobi Jackson | 59 carries, 354 yards, 6.0 per carry, 6 TD |
| Ohio State WR Jeremiah Smith | 48 receptions, 916 yards, 11 TD |
| Indiana WR Charlie Becker | 30 receptions, 529 yards, 8 TD |
| Indiana WR Nick Marsh | 29 receptions, 528 yards, 6 TD |
Jeremiah Smith’s 916 receiving yards and 11 touchdowns are among the most striking individual figures in this matchup. Indiana cannot allow the Buckeyes’ passing game to create uncontested explosives. On the other side, Richard’s 8.4 yards per carry and the combined production of Becker and Marsh demonstrate that Indiana has its own explosive-play potential. The Hoosiers need that explosiveness without abandoning the balance that has defined their best offensive performances.
The Pass-Rush Disparity Is Real—but Context Matters
Indiana has recorded 20 sacks to Ohio State’s nine. Stephen Daley and Tobi Osunsanmi each have five, meaning those two Hoosiers alone have combined for more sacks than Ohio State’s entire defense. Osunsanmi has 9.5 tackles for loss; Daley has six tackles for loss and two forced fumbles. That is an eye-catching statistical edge, but sack totals alone do not describe every pressure, coverage sack or defensive approach. Ohio State’s excellent pass-defense efficiency illustrates why the Buckeyes should not be judged by nine sacks alone.
Turnovers: A Subtle but Important Difference
| Turnover measure | Indiana | Ohio State |
|---|---|---|
| Interceptions gained | 4 | 4 |
| Defensive fumbles recovered | 0 | 4 |
| Total takeaways | 4 | 8 |
| Total giveaways | 1 | 6 |
| Turnover margin | +3 | +2 |
Turnover figures above follow the CFbstats takeaway/giveaway breakdown reviewed this week; the Big Ten’s separate all-purpose fumble-recovery table uses a different classification. Indiana has forced five fumbles but, according to the defensive takeaway breakdown, has yet to recover an opponent’s fumble. Ohio State has produced four defensive fumble recoveries. The Hoosiers have been better at protecting the football overall, with only one giveaway. Those are two different ways to influence possession margin.
What FPI, SP+ and Schedule Strength Tell Us
| Measure | Indiana | Ohio State |
|---|---|---|
| ESPN FPI | No. 7 (25.5) | No. 3 (28.2) |
| SP+ | No. 5 (26.7) | No. 1 (29.5) |
| ESPN overall efficiency | No. 6 | No. 5 |
| SP+ offense | No. 7 | No. 1 |
| SP+ defense | No. 4 | No. 1 |
| SP+ special teams | No. 38 | No. 102 |
| Strength of schedule, reviewed comparison | No. 52 | No. 29 |
These October 11–13 snapshots add context without replacing the football evaluation. FPI and SP+ are predictive, opponent-adjusted ratings rather than a score forecast for Saturday. Both place Ohio State ahead nationally, especially on offense and defense. Indiana has the better SP+ special-teams position. The separate strength-of-schedule comparison ranks Ohio State’s schedule more difficult to date, which matters when interpreting raw production against different opponents. Rankings are snapshots from different sources and should not be treated as synchronized live measurements.
The numbers establish a clear tactical contrast: Ohio State has the more productive passing attack and a formidable pass defense; Indiana has the more efficient rushing attack, stingier run defense and greater sack production. What remains to be determined on the field is whether those season-long tendencies hold up when each unit faces one of its toughest tests.
Coach Griff’s Final Word
Numbers establish tendencies, not outcomes. Ohio State brings greater passing volume and the conference’s most productive total offense. Indiana counters with a more productive ground game, outstanding yards-per-play efficiency, a relentless pass rush and excellent scoring defense.
For Indiana, the challenge is straightforward: create a more varied and efficient run game than the one we saw at Nebraska, make Ohio State earn every third down and finish red-zone possessions with touchdowns. For Ohio State, the priority is to protect the quarterback, avoid negative plays and force Indiana to move the ball methodically against a talented defense.
Those are the matchups I will carry into Thursday night’s Hoosier Football Tailgate preview.
Fast. Physical. Relentless.
Source: Big Ten Conference — 2026 Football Overall Statistics. Figures reflect the site snapshot reviewed October 13, 2026; any subsequent changes to the live conference table may not be reflected here.