By the Numbers: Indiana and Nebraska Are More Alike Than Different
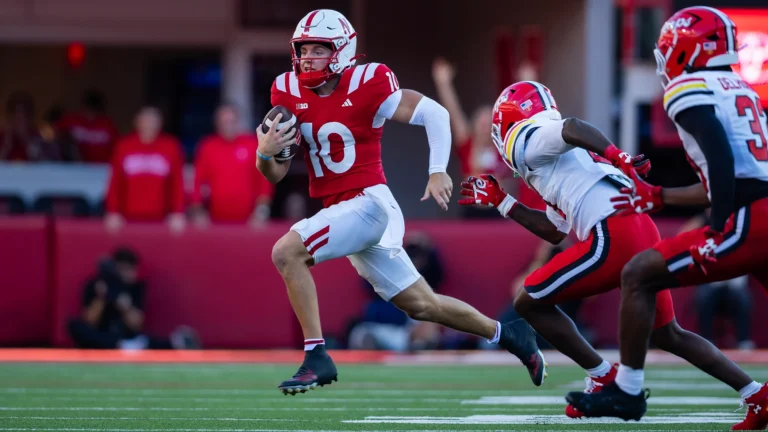
When I started digging deeper into Indiana and Nebraska this week, I expected to find a few statistical categories that clearly separated these two teams. Instead, I found something else: they are remarkably similar. Indiana enters Saturday’s noon kickoff in Lincoln at 5-0, and Nebraska is 5-0. Indiana averages 44.2 points per game; Nebraska averages 43.6. Indiana produces 489.6 yards per game; Nebraska averages 475.6. Indiana converts 51.9% of its third downs; Nebraska converts 52.4%. Those aren’t just two undefeated records. Those are two teams that, through five games, have arrived at those records in many of the same ways.
The Tale of the Tape
| Category | Indiana | Nebraska |
|---|---|---|
| Record | 5-0 | 5-0 |
| Points/Game | 44.2 | 43.6 |
| Total Offense/Game | 489.6 | 475.6 |
| Rushing/Game | 252.6 | 231.0 |
| Passing/Game | 237.0 | 244.6 |
| Yards/Play | 7.87 | 6.72 |
| Yards/Rush | 6.44 | 5.83 |
| Yards/Pass Attempt | 10.30 | 7.84 |
| Completion % | 70.4% | 66.0% |
| 3rd-Down Conversion | 51.9% | 52.4% |
| 4th-Down Conversion | 62.5% | 55.6% |
| Time of Possession | 31:47 | 32:34 |
If you only look at total production, there isn’t much separation. Both teams average more than 43 points, both are approaching 500 yards of offense, both average more than 230 rushing yards, and both convert more than half of their third downs. But the deeper numbers begin to reveal where Saturday’s game could turn.
Indiana’s Efficiency Is the First Difference
Indiana’s 489.6 yards per game isn’t dramatically better than Nebraska’s 475.6, but how Indiana is generating those yards is different. The Hoosiers average 7.87 yards every time they snap the football compared with Nebraska’s 6.72. Indiana also averages 6.44 yards per rushing attempt and 10.30 yards per pass attempt. Josh Hoover’s accuracy has complemented an explosive running game, creating an offense that doesn’t have to rely exclusively on long drives to score. Nebraska can move the football; Indiana has been more efficient doing it.
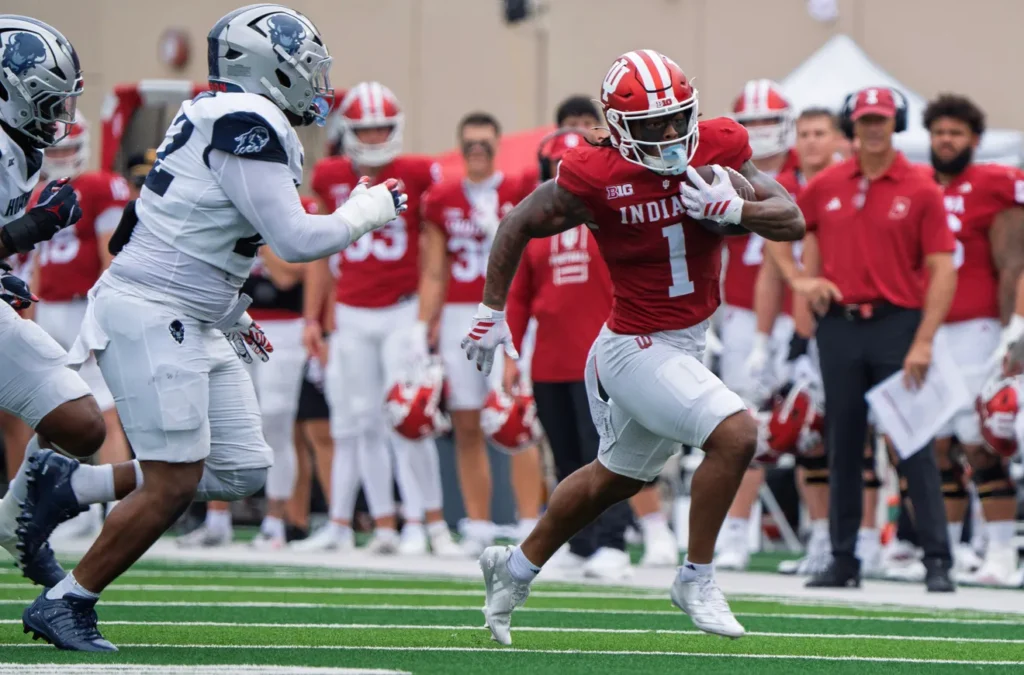
- Yards per play: Indiana 7.87, Nebraska 6.72.
- Yards per rush: Indiana 6.44, Nebraska 5.83.
- Yards per pass attempt: Indiana 10.30, Nebraska 7.84.
Flip the Field: The Defenses
| Category | Indiana | Nebraska |
|---|---|---|
| Points Allowed/Game | 10.8 | 14.2 |
| Total Defense/Game | 237.8 | 265.8 |
| Rushing Defense/Game | 64.4 | 100.6 |
| Passing Defense/Game | 173.4 | 165.2 |
| Yards/Play Allowed | 4.14 | 4.47 |
| Opponent 3rd Down | 26.9% | 21.3% |
| Opponent Completion % | 63.4% | 54.0% |
| Sacks | 15 | 16 |
| Tackles for Loss | 41 | 31 |
| Interceptions | 3 | 6 |
Indiana’s Run Defense Has Been a Problem for Everybody
Indiana is allowing just 64.4 rushing yards per game, and the Hoosiers have produced 41 tackles for loss compared with Nebraska’s 31. Bryant Haines’ defense isn’t merely limiting rushing production; it is putting offenses behind the chains. Negative plays change play calling, eliminate portions of the offensive menu and allow the defense to attack quarterbacks on obvious passing downs. Nebraska, however, brings a variable traditional rushing statistics don’t completely explain in quarterback Anthony Colandrea, whose ability to turn a covered pass play into a scramble makes rush-lane integrity critical.
- Indiana rushing defense: 64.4 yards allowed per game.
- Indiana tackles for loss: 41 through five games.
- The challenge: Keep Colandrea contained without changing the defense’s aggressive identity.
The Money Downs
Offensively, the third-down numbers are almost identical: Indiana converts 51.9% and Nebraska 52.4%. Defensively, Nebraska has been exceptional, allowing opponents to convert only 21.3% of their third downs compared with Indiana’s still-impressive 26.9%. That makes first and second down enormously important for Mike Shanahan’s offense. Third-and-2 keeps the entire playbook available; third-and-9 in Memorial Stadium allows Nebraska to dictate terms.
- Offensive third down: Indiana 51.9%, Nebraska 52.4%.
- Defensive third down: Indiana 26.9%, Nebraska 21.3%.
- Offensive fourth down: Indiana 62.5%, Nebraska 55.6%.
Games between evenly matched teams frequently create a critical fourth-down decision—fourth-and-2 around midfield, fourth-and-goal from the 2, or fourth-and-1 late in the fourth quarter. One conversion, or one stop, could completely change Saturday’s game.
Indiana Protects It. Nebraska Takes It Away.
| Turnover Category | Indiana | Nebraska |
|---|---|---|
| Turnovers Lost | 1 | 2 |
| Takeaways | 3 | 8 |
| Turnover Margin | +2 | +6 |
| Interceptions | 3 | 6 |
Indiana has lost the football only once in five games, while Nebraska has generated eight takeaways. That creates one of the best strength-on-strength matchups of the afternoon: a team demonstrating exceptional ball security against a defense creating extra possessions. Nebraska’s six interceptions are particularly important because Hoover has done an excellent job taking care of the football. There will be moments when Nebraska tries to disguise coverage and entice him into a throw that isn’t there; sometimes the punt is not a bad play.
One additional number remains worth tracking: points off turnovers. Turnover margin tells us how many possessions changed hands, but not how effectively each team capitalized on those mistakes. That’s a useful distinction as Saturday unfolds.
The Biggest Statistical Difference Might Be Discipline
Indiana averages only 27.6 penalty yards per game compared with Nebraska’s 73.4, a difference of 45.8 yards every Saturday. Penalty yardage doesn’t tell the entire story, either. A holding call can turn second-and-4 into second-and-14, while a defensive penalty after a third-down stop can hand an offense another possession of downs. That’s hidden yardage, and in a game between two statistically similar teams, it matters.
- Indiana penalty yards/game: 27.6.
- Nebraska penalty yards/game: 73.4.
- Difference: 45.8 yards per game in Indiana’s favor.
The Last Five Yards Still Matter
There is one concern the overall statistics don’t eliminate: Indiana’s ability to consistently run the football inside the opponent’s 5-yard line. The Hoosiers have demonstrated they can move the football between the 20s, but Saturday could make each possession more valuable. Near the goal line the field compresses, safeties become part of the run fit, horizontal and vertical space disappear, and formation, motion, RPO decisions—and potentially Josh Hoover becoming part of the run equation—become increasingly important. In a game this statistically close, seven instead of three is enormous.
Coach Griff’s Final Word
The deeper I dig into Indiana and Nebraska, the more I come back to the same conclusion: these teams are more alike than different. They’re both 5-0, both score more than 43 points per game, both produce more than 475 yards of offense, both run the football effectively, both convert more than half of their third downs, and both have defenses capable of disrupting an offense.
The separation is found in the details. Indiana has been more efficient offensively and better defending the run. Nebraska has been exceptional on defensive third down and has created more takeaways. Indiana has been dramatically more disciplined in the penalty game and has protected the football about as well as anyone could ask. Saturday probably isn’t going to be decided because one team suddenly proves itself vastly superior to the other; it’s much more likely to be decided by a third-down stop, a fourth-down conversion, a turnover, a penalty, a red-zone possession or one explosive play.
When two teams look this similar statistically, the big numbers may cancel each other out. It’s the little numbers that could decide who leaves Lincoln 6-0.