Indiana vs. Washington: Tale of the Tape — Can the Huskies Match the Hoosiers’ Physicality?
Coach Griff’s statistical breakdown of the offenses, defenses, key personnel and matchups that could determine Saturday’s Big Ten showdown in Seattle.
Saturday, November 21, 2026 | Indiana (9–1, 6–1 Big Ten) at Washington (6–4, 3–4 Big Ten)
Indiana heads west following a 27–13 victory over No. 18 USC, carrying aspirations of competing for a Big Ten Championship and College Football Playoff berth. Washington has endured a frustrating season despite expectations of challenging the conference’s upper tier. Three Huskies losses have come by four points or fewer. Washington can challenge opposing secondaries and has produced 13 interceptions. But the statistical matchup reveals significant Indiana advantages in the running game, defensive efficiency and negative plays.
Tale of the Tape: Offense vs. Offense
| Category | Indiana | Washington |
| Points/game | 31.9 | 25.8 |
| Total yards/game | 422.7 | 361.2 |
| Rush yards/game | 182.2 | 93.8 |
| Yards/rush | 5.2 | 3.4 |
| Pass yards/game | 240.5 | 267.4 |
| Completion % | 60.1% | 66.4% |
| Yards/pass attempt | 9.32 | 7.55 |
| Pass TD | 24 | 21 |
| Interceptions thrown | 3 | 7 |
| Yards/play | 7.0 | 5.8 |
| Third down | 41.7% | 34.9% |
| Fourth down | 50.0% | 69.2% |
| Red-zone TD % | 61.5% | 65.0% |
| Sacks allowed | 15 | 28 |
| Turnovers lost | 7 | 11 |
| Possession/game | 29:29 | 28:57 |
Coach Griff’s analysis: Indiana’s offense is more balanced and explosive
Indiana averages 61.5 more offensive yards per game and 1.2 more yards per play. Its 182.2 rushing yards per game nearly doubles Washington’s 93.8. The Hoosiers have also thrown only three interceptions in 258 attempts, compared with Washington’s seven in 354. However, Indiana’s season averages require context: 145 points came in the first three games against North Texas, Howard and Western Kentucky. The offense has been less consistent against Big Ten opponents. Washington’s passing production and completion percentage remain real strengths.
Tale of the Tape: Defense vs. Defense
| Category | Indiana | Washington |
| Points allowed/game | 12.5 | 21.1 |
| Total yards allowed/game | 274.2 | 349.6 |
| Rush yards allowed/game | 77.8 | 132.4 |
| Yards/rush allowed | 2.4 | 3.9 |
| Pass yards allowed/game | 196.4 | 217.2 |
| Opponent completion % | 59.6% | 59.4% |
| Opponent yards/pass attempt | 6.20 | 6.94 |
| Opponent pass TD | 7 | 14 |
| Yards/play allowed | 4.3 | 5.3 |
| Opponent third down | 30.2% | 34.3% |
| Opponent fourth down | 43.5% | 52.9% |
| Opponent red-zone TD % | 32.0% | 56.7% |
| Sacks | 32 | 19 |
| TFL | 80 | 56 |
| Interceptions | 10 | 13 |
| Takeaways | 12 | 16 |
Coach Griff’s analysis: Indiana’s defense is operating at a championship level
Indiana allows 12.5 points and 274.2 yards per game, versus Washington’s 21.1 and 349.6. The Hoosiers allow only 4.3 yards per play, have 32 sacks and 80 tackles for loss, and have permitted touchdowns on just eight of 25 opponent red-zone trips (32%). Washington has allowed touchdowns on 17 of 30 such trips (56.7%). Washington’s notable counterweight is takeaways: 13 interceptions and three fumble recoveries for 16 total. Indiana is the more complete defense statistically, but the Huskies are opportunistic.
Indiana Offense vs. Washington Defense
| Matchup | IU offense | UW defense allows |
| Points/game | 31.9 | 21.1 |
| Total yards/game | 422.7 | 349.6 |
| Rush yards/game | 182.2 | 132.4 |
| Pass yards/game | 240.5 | 217.2 |
| Yards/play | 7.0 | 5.3 |
| Third down | 41.7% | 34.3% |
| Red-zone TD | 61.5% | 56.7% |
| Sacks | 15 allowed | 19 made |
| Interceptions | 3 thrown | 13 made |
The offensive game plan
Indiana should establish a physical rushing attack against a Washington defense surrendering 132.4 yards per game. Power, counter, perimeter runs and quarterback involvement should complement inside zone and duo. A credible ground game can create play-action opportunities, but the quarterback must respect Washington’s 13 interceptions and avoid predictable passing situations.
Indiana offensive performance objectives: 175+ rushing yards; 30+ points; 45%+ on third down; 70%+ red-zone touchdown rate; no more than two sacks allowed; zero interceptions.
Washington Offense vs. Indiana Defense
| Matchup | UW offense | IU defense allows |
| Points/game | 25.8 | 12.5 |
| Total yards/game | 361.2 | 274.2 |
| Rush yards/game | 93.8 | 77.8 |
| Pass yards/game | 267.4 | 196.4 |
| Yards/play | 5.8 | 4.3 |
| Third down | 34.9% | 30.2% |
| Red-zone TD | 65.0% | 32.0% |
| Sacks | 28 allowed | 32 made |
| Interceptions | 7 thrown | 10 made |
The defensive game plan
Washington averages only 93.8 rushing yards and has allowed 28 sacks. Indiana’s defense has held opponents to 77.8 rushing yards per game and recorded 32 sacks. That matchup offers an opportunity to create predictable passing downs. The pass rush must remain disciplined against Demond Williams Jr.’s mobility, while the secondary limits explosive completions to Chris Lawson and Dezmen Roebuck.
Indiana defensive performance objectives: fewer than 100 rushing yards allowed; fewer than 225 passing yards; four or more sacks; two or more takeaways; opponent third-down rate below 30%; 17 or fewer points allowed.
Key Personnel: Who Can Decide the Matchup?
Charlie Becker, Indiana WR: 53 catches, 950 yards, 10 touchdowns and 17.9 yards per reception. He is Indiana’s leading receiver and primary explosive-play threat.
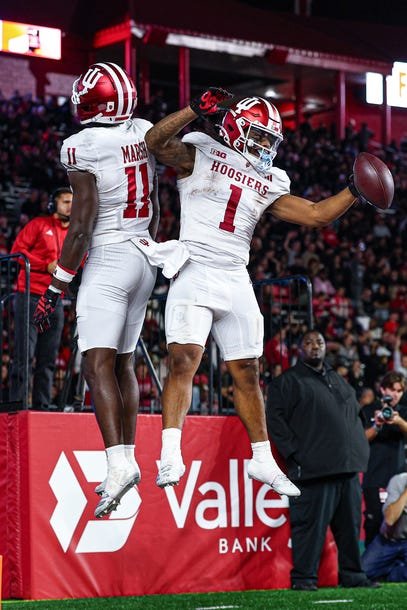
Nick Marsh, Indiana WR: 42 catches, 749 yards and eight touchdowns. His downfield ability prevents Washington from concentrating exclusively on Becker.
Chris Lawson, Washington WR: 54 catches, 851 yards and five touchdowns, averaging 15.8 yards per catch. Indiana must prevent explosive completions.
Alex McLaughlin, Washington defender: 74 tackles, 8.5 tackles for loss, three sacks and three interceptions. Indiana must account for his run support and pass-defense production.
Special Teams: An Overlooked Factor
| Category | Indiana | Washington |
| Field-goal percentage | 65.2% | 81.3% |
| Gross punting average | 39.9 | 47.9 |
| Net punting average | 37.3 | 42.7 |
| Kick return average | 19.3 | 18.8 |
| Punt return average | 11.4 | 5.1 |
| Opponent punt return average | 8.0 | 8.7 |
| Penalty yards/game | 37.3 | 59.8 |
Washington punter Hunter Green averages 47.9 yards per punt, compared with Indiana’s Billy Gowers at 39.9. Washington has made 13 of 16 field goals (81.3%), compared with Indiana’s 15 of 23 (65.2%). Indiana has the better punt-return average, but cannot allow special-teams errors to hand Washington field position or extra possessions.
Coach Griff’s Five Things That Matter
- Establish the running game. Turn Indiana’s season-long rushing advantage into first-down efficiency.
- Pressure the quarterback without losing contain. Indiana’s 32 sacks meet a Washington offense that has allowed 28.
- Protect the football. Washington’s 13 interceptions can equalize Indiana’s statistical advantages.
- Win the red zone on both sides. Indiana’s defense has allowed a 32% red-zone TD rate, while its own offense has converted 61.5%.
- Play with championship-level discipline. Avoid penalties, protection breakdowns and special-teams mistakes.
The Final Assessment: Indiana Has the Advantages, But Must Execute
Indiana leads in scoring offense, total offense, rushing production, scoring defense, total defense, sacks and tackles for loss. Washington has the better passing-yardage average, more interceptions and the ability to keep games close. The challenge for Indiana remains offensive consistency. If the Hoosiers run effectively, protect the football and force predictable passing situations, they should be positioned to control the game. If Washington creates turnovers and wins field position, the Huskies can make Saturday uncomfortable.
The numbers favor Indiana. The challenge is turning those advantages into four quarters of winning football.
— Coach Griff | Hoosier Football Tailgate
Sources: Official 2026 Indiana University Football and University of Washington Football overall statistics, both as of November 15, 2026 (user-supplied PDFs). All statistics are season-to-date, not Big Ten-only. Tactical targets are editorial analysis; personnel availability is not confirmed. Washington has 19 defensive sacks and has allowed 28 offensive sacks.